
Tools & apps
Making Sense of Your Junior Golf Tech Stack
October 4, 2026
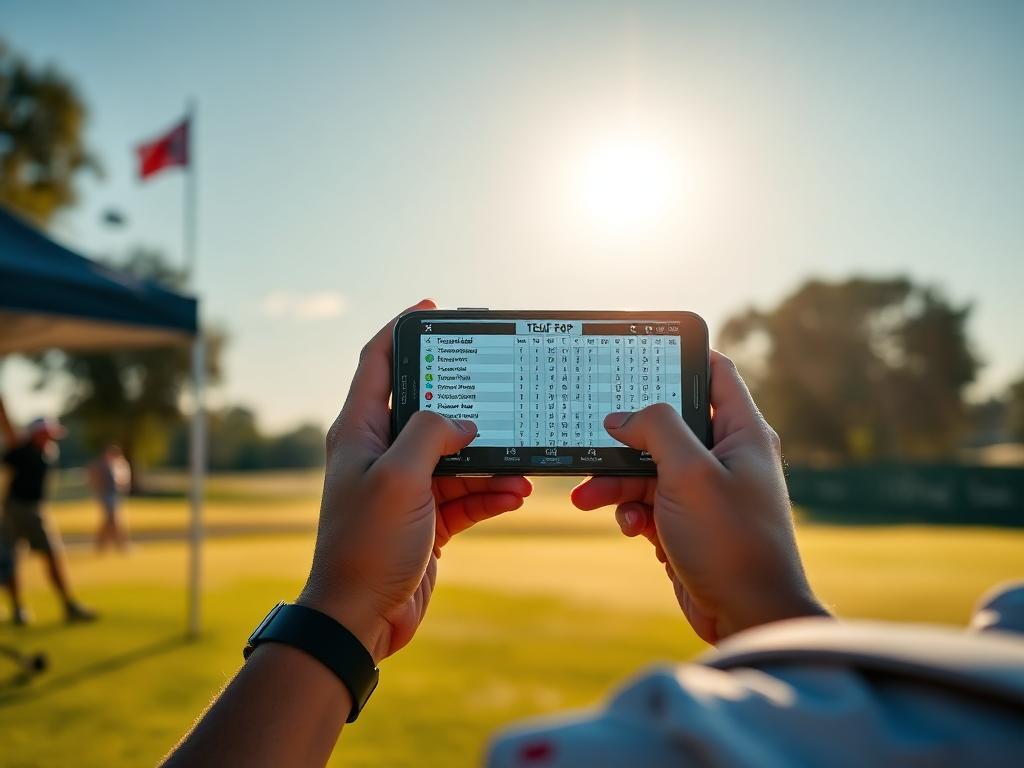
Tour portals, launch monitors, GPS apps, and stat trackers often operate in silos. Here is how to connect your data into a system college coaches respect.
Most competitive high school golfers have a phone full of golf apps: tournament portals like BlueGolf and Golf Genius, a launch monitor app for range sessions, an on-course GPS tool, and a dedicated strokes-gained stat tracker.
The issue is rarely a lack of data. The issue is fragmentation. When your practice data sits in one silo, your tournament scores sit in another, and your on-course decision-making is logged nowhere, you lose the insights required to improve efficiently.
To build a useful recruiting profile and target your practice, you need to understand what each tool does best and where players consistently drop critical information.
Tour Portals: Official Scoring and Leaderboards
Tour platforms—principally BlueGolf (used across the Legends Junior Tour, Northern Texas PGA, and Texas Junior Golf Tour), Golf Genius (common in high school UIL events and USGA qualifiers), and the AJGA app—serve one primary master: event administration.
What they do well
- Manage pairings, starting times, and live leaderboards.
- House the official record of your tournament scoring average and differential.
- Provide public-facing tournament results that college coaches verify directly.
Where the data breaks down
Tour portals only track outcomes, not causes. A 74 on BlueGolf shows 18 hole-by-hole scores. It does not show whether your bogeys came from loose iron play, poor lag putting, or errant driving. If you rely solely on your tournament profile history, you have no diagnostic data to structure your next week of practice.
Launch Monitors and Simulators: Delivery and Carry Numbers
Whether you use a TrackMan, FlightScope, Foresight GCQuad, or a local simulator bay, launch monitor apps provide precise measurement of impact and ball flight.
What they do well
- Dialing in exact carry baselines for every club in the bag.
- Measuring club delivery metrics: club path, face angle, angle of attack, and spin rates.
- Verifying gapping across scoring clubs and wedges.
Where the data breaks down
Range mats and indoor bays remove turf interaction, lies, wind, and tournament adrenaline. Players often log baseline wedge carries on a simulator in 70-degree still air, then fail to adjust for heavy fall air or firm fairway conditions at tournaments like the James A. Ragan Memorial at Corpus Christi Country Club or the NTPGA Fall Championship at Texas Rangers Golf Club. Simulator numbers are pure baselines, not field guarantees.
On-Course GPS and Yardage Tools
Apps like Arccos, 18Birdies, or dedicated rangefinder software give aerial course architecture, elevation changes, and distance mapping.
What they do well
- Visualizing target lines off tees and hazard runouts during practice rounds.
- Calculating adjusted yardages for elevation and temperature changes.
Where the data breaks down
Rules of golf and tournament conditions matter. In most competitive junior and high school events, using a phone as an active GPS during competition rounds is strictly prohibited or heavily restricted. If your entire strategy relies on looking at a phone screen, your execution suffers when you must rely strictly on a laser and a paper yardage book on tournament day.
Dedicated Stat Trackers: The Central Engine
Platforms built for performance analysis (such as Decade, Clippd, or Golfmetrics) exist to bridge the gap between tournament scorecards and practice planning.
To make this system work:
- Use a paper yardage book during the round: Note your exact target, the lie, club used, distance to hole, and final proximity or putt distance.
- Upload within 12 hours: Input your raw data into your stat platform the evening after your round while memory is fresh.
- Cross-reference with launch data: If your stat app reveals that your approach proximity from 140–160 yards cost you 1.8 strokes per round, take that specific issue back to the launch monitor to check strike quality and face-to-path consistency.
This Week's Action Step
Pick your last three competitive tournament rounds. Transfer the raw data—fairways, greens in regulation, scrambling opportunities converted, and total putts—into a single spreadsheet or stat tracker. Identify the one recurring miss that cost you the most strokes, and dedicate your first practice session this week exclusively to fixing that specific yardage or shot type.
Track your own numbers
Log every round hole by hole, import verified tour scores automatically, and send coaches a stat page that stays current.